Budget Controlling & Variance Analysis Dashboard
Overview
Budget Controlling & Variance Analysis Dashboard
The Challenge
A complex, multi-program organization relied heavily on spreadsheet-based financial reporting to monitor budgets and operational spend.
This approach created several issues:
Financial reports were manual, slow, and error-prone
Leadership lacked real-time visibility into cash position and budget performance
Overspends were often identified after month-end, limiting corrective action
Financial data was difficult to interpret at an executive level, leading to reactive decision-making
The Solution
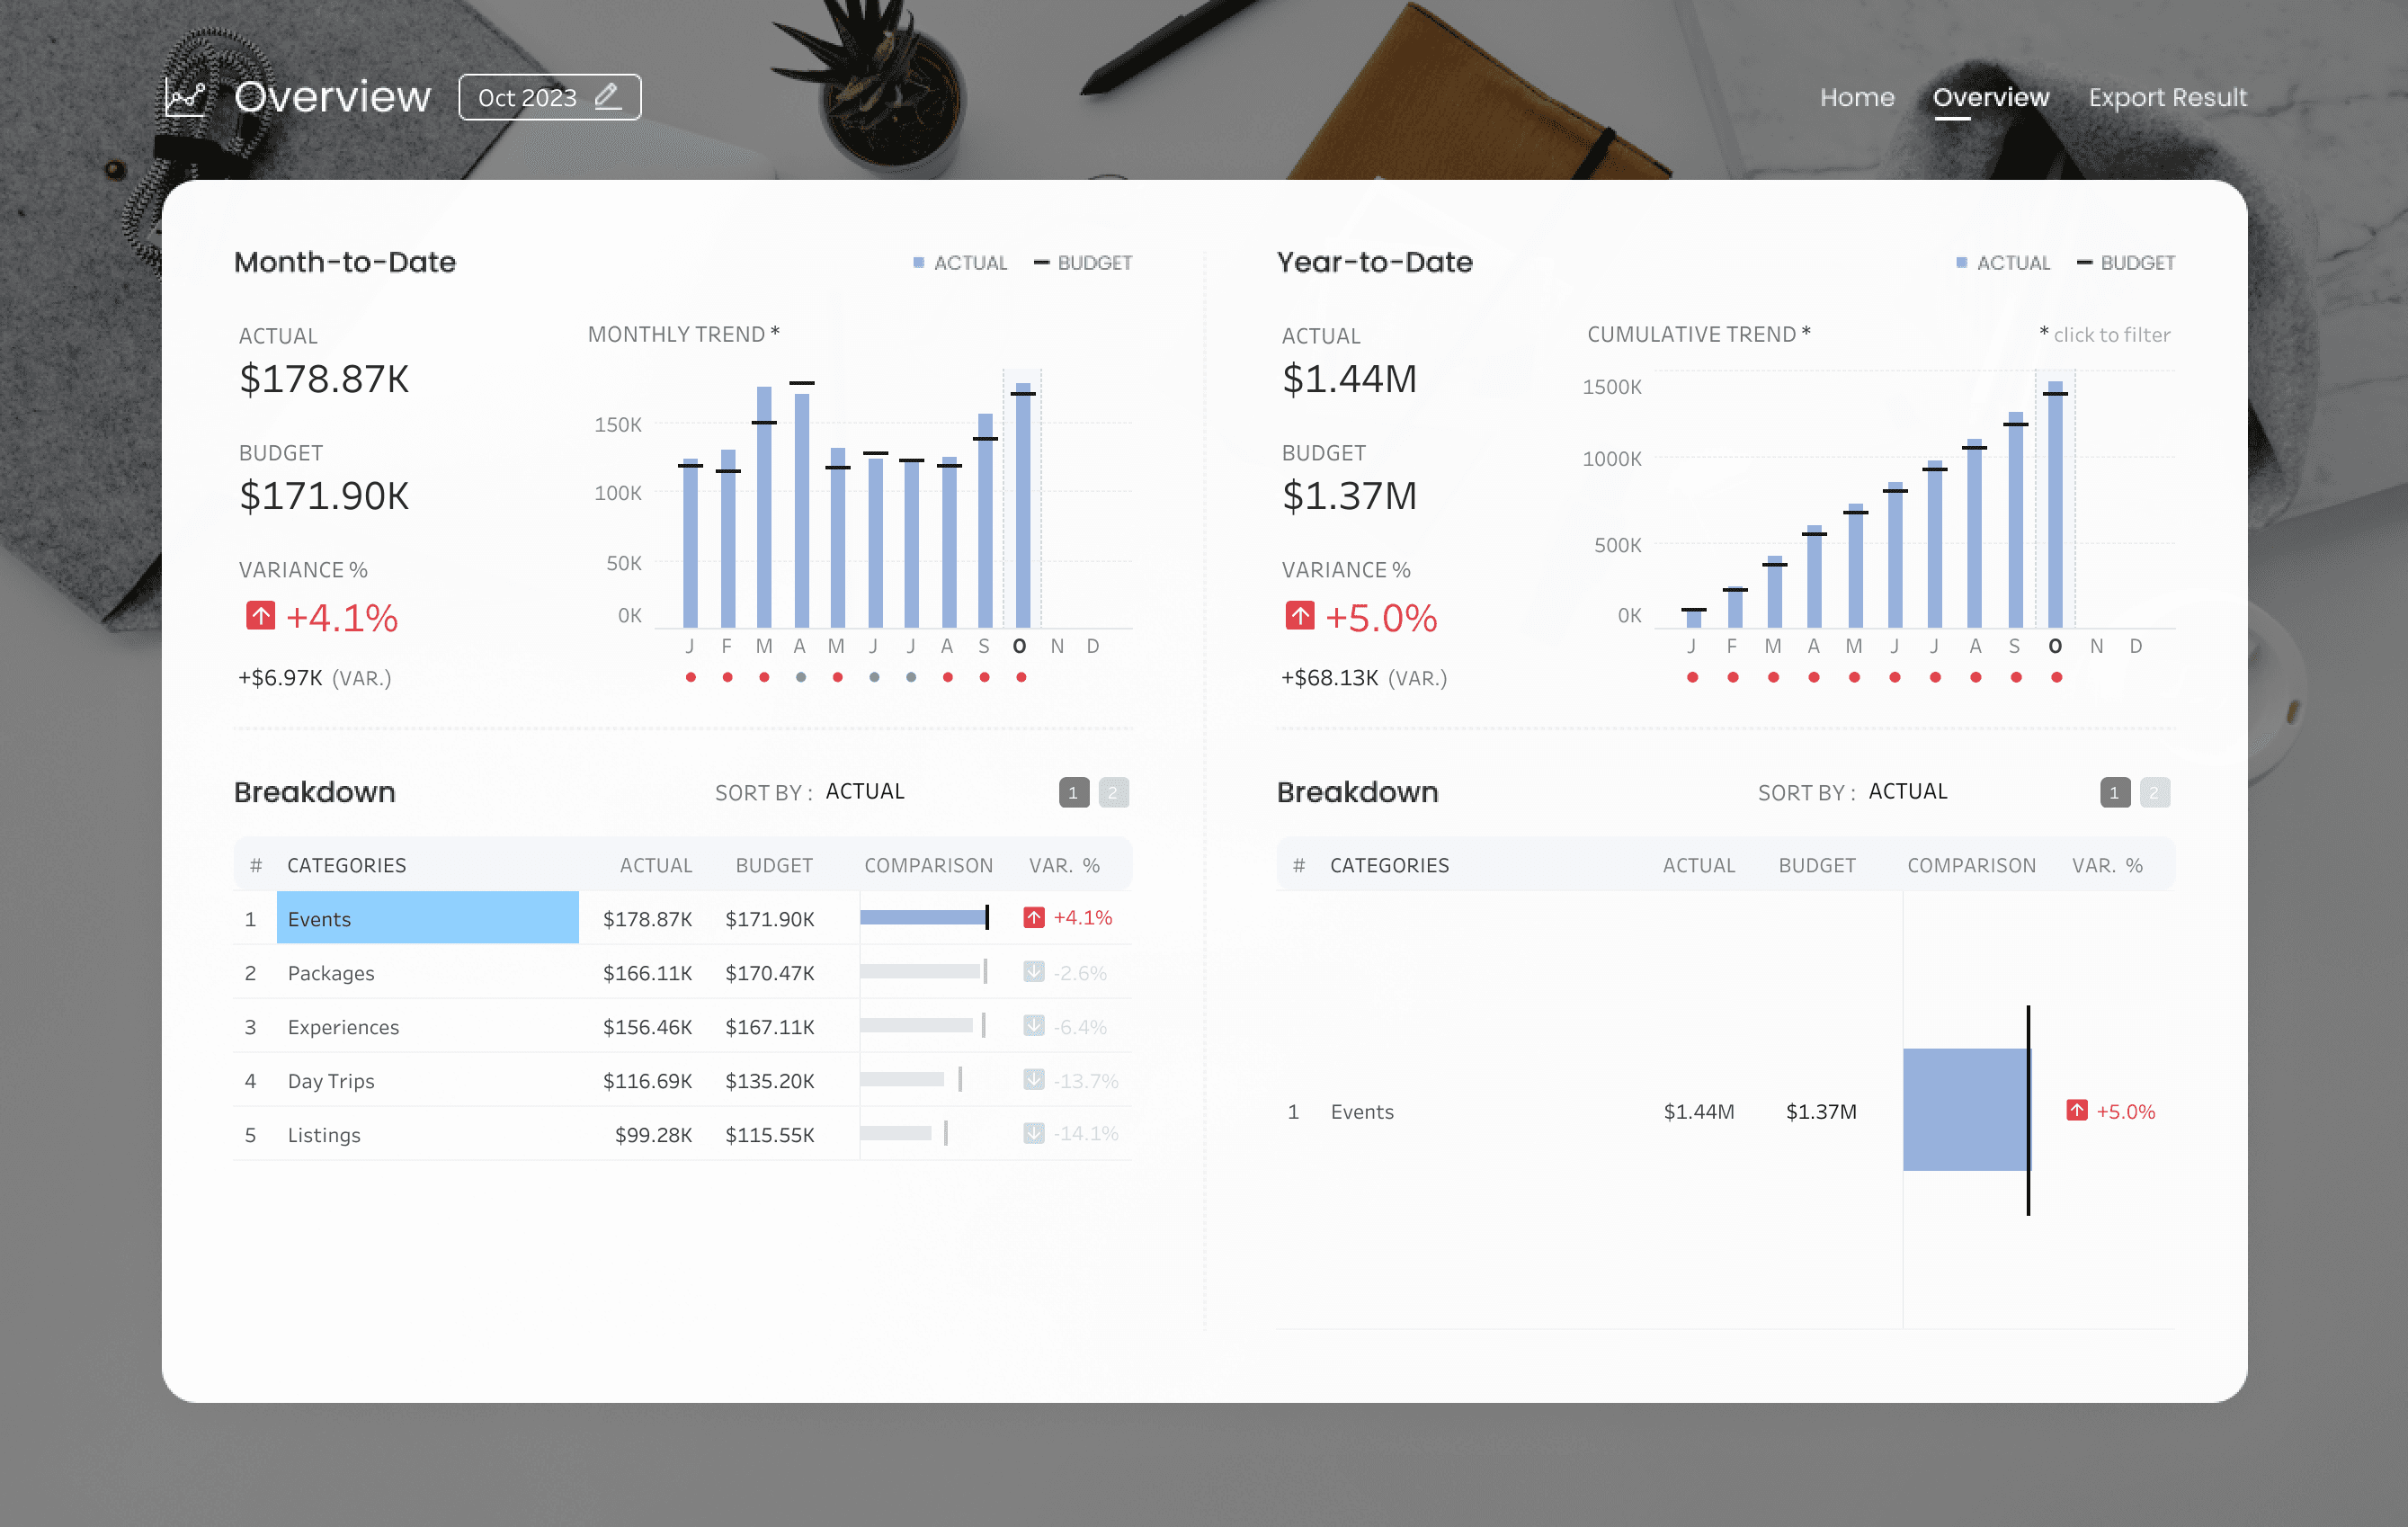
I designed and implemented a real-time Budget Controlling & Variance Analysis Dashboard that consolidated financial data from multiple sources into a single, trusted source of truth.
The solution delivered:
An executive “Home” snapshot with gauge charts for immediate MTD and YTD financial health checks
Automated budget vs. actual variance tracking with traffic-light logic to instantly flag overspending cost centers
A tiered drill-down architecture, allowing users to move from high-level summaries to granular line items (e.g., Events, Marketing)
Dynamic switching between Month-to-Date (MTD) and Year-to-Date (YTD) views
Built-in data export functionality to support audit and compliance workflows
The Outcome
Financial reporting latency was reduced from days to near real-time
Budget overruns were identified mid-month rather than post-month-end
Leadership gained confidence in financial data accuracy and accessibility
The organization transitioned from static PDF reports to interactive, self-service financial analysis
Financial control shifted from reactive reporting to proactive budget management
Skills Demonstrated
Financial analysis & budget variance modeling
Business intelligence & dashboard design
Data modeling, transformation, and validation
KPI development and executive reporting
Stakeholder-focused financial storytelling
Categories
Tableau
Travel finances
Date
Jan 15, 2025
Client
Trafalgar(Canada)


Budget Controlling & Variance Analysis Dashboard
Overview
Budget Controlling & Variance Analysis Dashboard
The Challenge
A complex, multi-program organization relied heavily on spreadsheet-based financial reporting to monitor budgets and operational spend.
This approach created several issues:
Financial reports were manual, slow, and error-prone
Leadership lacked real-time visibility into cash position and budget performance
Overspends were often identified after month-end, limiting corrective action
Financial data was difficult to interpret at an executive level, leading to reactive decision-making
The Solution
I designed and implemented a real-time Budget Controlling & Variance Analysis Dashboard that consolidated financial data from multiple sources into a single, trusted source of truth.
The solution delivered:
An executive “Home” snapshot with gauge charts for immediate MTD and YTD financial health checks
Automated budget vs. actual variance tracking with traffic-light logic to instantly flag overspending cost centers
A tiered drill-down architecture, allowing users to move from high-level summaries to granular line items (e.g., Events, Marketing)
Dynamic switching between Month-to-Date (MTD) and Year-to-Date (YTD) views
Built-in data export functionality to support audit and compliance workflows
The Outcome
Financial reporting latency was reduced from days to near real-time
Budget overruns were identified mid-month rather than post-month-end
Leadership gained confidence in financial data accuracy and accessibility
The organization transitioned from static PDF reports to interactive, self-service financial analysis
Financial control shifted from reactive reporting to proactive budget management
Skills Demonstrated
Financial analysis & budget variance modeling
Business intelligence & dashboard design
Data modeling, transformation, and validation
KPI development and executive reporting
Stakeholder-focused financial storytelling
Categories
Tableau
Travel finances
Date
Jan 15, 2025
Client
Trafalgar(Canada)
Budget Controlling & Variance Analysis Dashboard
Overview
Budget Controlling & Variance Analysis Dashboard
The Challenge
A complex, multi-program organization relied heavily on spreadsheet-based financial reporting to monitor budgets and operational spend.
This approach created several issues:
Financial reports were manual, slow, and error-prone
Leadership lacked real-time visibility into cash position and budget performance
Overspends were often identified after month-end, limiting corrective action
Financial data was difficult to interpret at an executive level, leading to reactive decision-making
The Solution
I designed and implemented a real-time Budget Controlling & Variance Analysis Dashboard that consolidated financial data from multiple sources into a single, trusted source of truth.
The solution delivered:
An executive “Home” snapshot with gauge charts for immediate MTD and YTD financial health checks
Automated budget vs. actual variance tracking with traffic-light logic to instantly flag overspending cost centers
A tiered drill-down architecture, allowing users to move from high-level summaries to granular line items (e.g., Events, Marketing)
Dynamic switching between Month-to-Date (MTD) and Year-to-Date (YTD) views
Built-in data export functionality to support audit and compliance workflows
The Outcome
Financial reporting latency was reduced from days to near real-time
Budget overruns were identified mid-month rather than post-month-end
Leadership gained confidence in financial data accuracy and accessibility
The organization transitioned from static PDF reports to interactive, self-service financial analysis
Financial control shifted from reactive reporting to proactive budget management
Skills Demonstrated
Financial analysis & budget variance modeling
Business intelligence & dashboard design
Data modeling, transformation, and validation
KPI development and executive reporting
Stakeholder-focused financial storytelling
Categories
Tableau
Travel finances
Date
Jan 15, 2025
Client
Trafalgar(Canada)